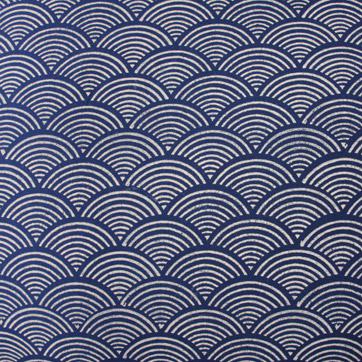
Animating an ancient Japanese wave pattern
There's a pattern that I first saw in Japan that I really like. It's a sort of wave pattern. One example that I found on the internet looks like this:

In this post, I'll try to first draw it using Matplotlib and then animate it using MoviePy.
The elementary pattern
In this section, we'll concentrate on drawing the elementary pattern that we will subsequently use to assemble the final result. First, we load our prerequisites:
%matplotlib inline
import matplotlib as mpl
import pylab as pl
Below, we write a function that creates a round wedge with different colors inside:
def draw_elementary_pattern(ax, center, number_of_waves, wave_color=(0.8, 0.7, 1.0)):
counter = 0
for wave in range(number_of_waves)[::-1]:
if counter % 2 == 0:
ax.add_artist(mpl.patches.Wedge(center,
1./number_of_waves * (wave + 1),
0, 180,
width=1./number_of_waves, fc=wave_color))
else:
ax.add_artist(mpl.patches.Wedge(center,
1./number_of_waves * (wave + 1),
0, 180,
width=1./number_of_waves, fc='white'))
counter += 1
We can test this code to see the result:
ax = pl.gca()
draw_elementary_pattern(ax, (0, 0), 3)
pl.xlim(-1, 1)
pl.ylim(-1, 1)
(-1, 1)
Creating the wave pattern
Now that we have this elementary pattern, we can stack it to produce the Japanese style image that I like. The way it is laid out is interesting: we start with the upper layers and stack the lower layers on top. Also, we shift on row with respect to its neighbors.
pl.figure(figsize=(6, 5))
ax = pl.gca()
for row in range(20)[::-1]:
for column in range(8):
center = (column * 2 + row % 2, row/2.)
draw_elementary_pattern(ax, center, 6)
pl.xlim(0, 15)
pl.ylim(1, 10)
pl.axis('off')
(0.0, 15.0, 1.0, 10.0)
That's it: we reached a visually pleasing goal! All with very few lines of code!
We can also vary the number of wedges we use, or the colors.
Below, we increase the number of waves.
pl.figure(figsize=(6, 5))
ax = pl.gca()
for row in range(20)[::-1]:
for column in range(8):
center = (column * 2 + row % 2, row/2.)
draw_elementary_pattern(ax, center, 8)
pl.xlim(0, 15)
pl.ylim(1, 10)
pl.axis('off')
(0.0, 15.0, 1.0, 10.0)
What about changing the color as a function of row?
pl.figure(figsize=(6, 5))
ax = pl.gca()
for row in range(20)[::-1]:
for column in range(8):
center = (column * 2 + row % 2, row/2.)
draw_elementary_pattern(ax, center, 9, wave_color=(0.8 * row/19., 0.7 * row/19., 1.0))
pl.xlim(0, 15)
pl.ylim(1, 10)
pl.axis('off')
(0.0, 15.0, 1.0, 10.0)
This last one produces an interesting coloring effect, which could almost be likened to the appearance of the sea.
Animating the wave pattern
Now that we have a wave pattern, we're going to play a little bit with animations (this is made possible using the work by the great Zulko).
The first thing we will do below is to move the waves to the bottom of the screen. Because, erh, that's what waves do: they move!
import matplotlib.pyplot as plt
import numpy as np
from moviepy.video.io.bindings import mplfig_to_npimage
import moviepy.editor as mpy
duration = 2
fig_mpl, ax = plt.subplots(1, figsize=(6, 5), facecolor='white')
def make_frame_mpl(t):
ax.cla()
for row in range(20)[::-1]:
for column in range(8):
center = (column * 2 + row % 2, row/2. - t/duration)
draw_elementary_pattern(ax, center, 6)
pl.xlim(0, 13)
pl.ylim(1, 9)
pl.axis('off')
return mplfig_to_npimage(fig_mpl) # RGB image of the figure
animation = mpy.VideoClip(make_frame_mpl, duration=duration)
animation.write_gif("files/circles.gif", fps=20)
[MoviePy] Building file files/circles.gif with imageio
To embed these waves properly in this notebook as gif images, we're going to write a function that does just that:
import base64
from IPython.display import HTML
def embed_as_gif(filename):
with open(filename, "rb") as image_file:
encoded_string = base64.b64encode(image_file.read())
return HTML('<img src="data:image/gif;base64,{0}">'.format(encoded_string))
embed_as_gif('./files/circles.gif')
What about if we use some oscillating pattern? First, we try with a fixed amplitude for every elementary pattern:
duration = 2
fig_mpl, ax = plt.subplots(1, figsize=(6, 5), facecolor='white')
def make_frame_mpl(t):
ax.cla()
for row in range(20)[::-1]:
for column in range(8):
center = (column * 2 + row % 2 + np.sin(2 * np.pi * t/duration), row/2. - t/duration)
draw_elementary_pattern(ax, center, 6)
pl.xlim(1, 13)
pl.ylim(1, 9)
pl.axis('off')
return mplfig_to_npimage(fig_mpl) # RGB image of the figure
animation = mpy.VideoClip(make_frame_mpl, duration=duration)
animation.write_gif("files/circles2.gif", fps=20)
[MoviePy] Building file files/circles2.gif with imageio
embed_as_gif('./files/circles2.gif')
This is nice, but what if we want a pattern with some oscillations that are more important in the middle of the screen?
duration = 2
fig_mpl, ax = plt.subplots(1, figsize=(6, 5), facecolor='white')
def make_frame_mpl(t):
ax.cla()
for row in range(20)[::-1]:
for column in range(8):
center = (column * 2 + row % 2 + 0.01 * np.sin(2 * np.pi * t/duration) * row * (20 - row), row/2. - t/duration)
draw_elementary_pattern(ax, center, 6)
pl.xlim(1, 13)
pl.ylim(1, 9)
pl.axis('off')
return mplfig_to_npimage(fig_mpl) # RGB image of the figure
animation = mpy.VideoClip(make_frame_mpl, duration=duration)
animation.write_gif("files/circles3.gif", fps=20)
[MoviePy] Building file files/circles3.gif with imageio
embed_as_gif('./files/circles3.gif')
Another idea is to play with the colors:
duration = 2
fig_mpl, ax = plt.subplots(1, figsize=(6, 5), facecolor='white')
def make_frame_mpl(t):
ax.cla()
for row in range(20)[::-1]:
for column in range(8):
center = (column * 2 + row % 2, row/2. - t/duration)
draw_elementary_pattern(ax, center, 9,
wave_color=(0.8 * np.abs(np.sin(2 * np.pi * 0.5 * t/duration - 2 * row/19.)),
0.7 * np.abs(np.sin(2 * np.pi * 0.5 * t/duration - column/7.)),
1.0))
pl.xlim(1, 13)
pl.ylim(1, 9)
pl.axis('off')
return mplfig_to_npimage(fig_mpl) # RGB image of the figure
animation = mpy.VideoClip(make_frame_mpl, duration=duration)
animation.write_gif("files/circles4.gif", fps=20)
[MoviePy] Building file files/circles4.gif with imageio
embed_as_gif('./files/circles4.gif')
There are many more variations that could be obtained using this basic wave pattern. If you're interested, download this notebook and have fun by trying it out for yourself!
Conclusion
I hope you liked these simple animations using Matplotlib and Moviepy. As you have seen, you don't necessarily need a lot of things to create interesting visualizations. And the nicest thing is that this can be done using very few lines of code.
This post was entirely written using the IPython notebook. You can see a static view or download this notebook with the help of nbviewer at 20150225_JapanesePattern.ipynb.