What would Maxwell plot? (a replication with matplotlib)
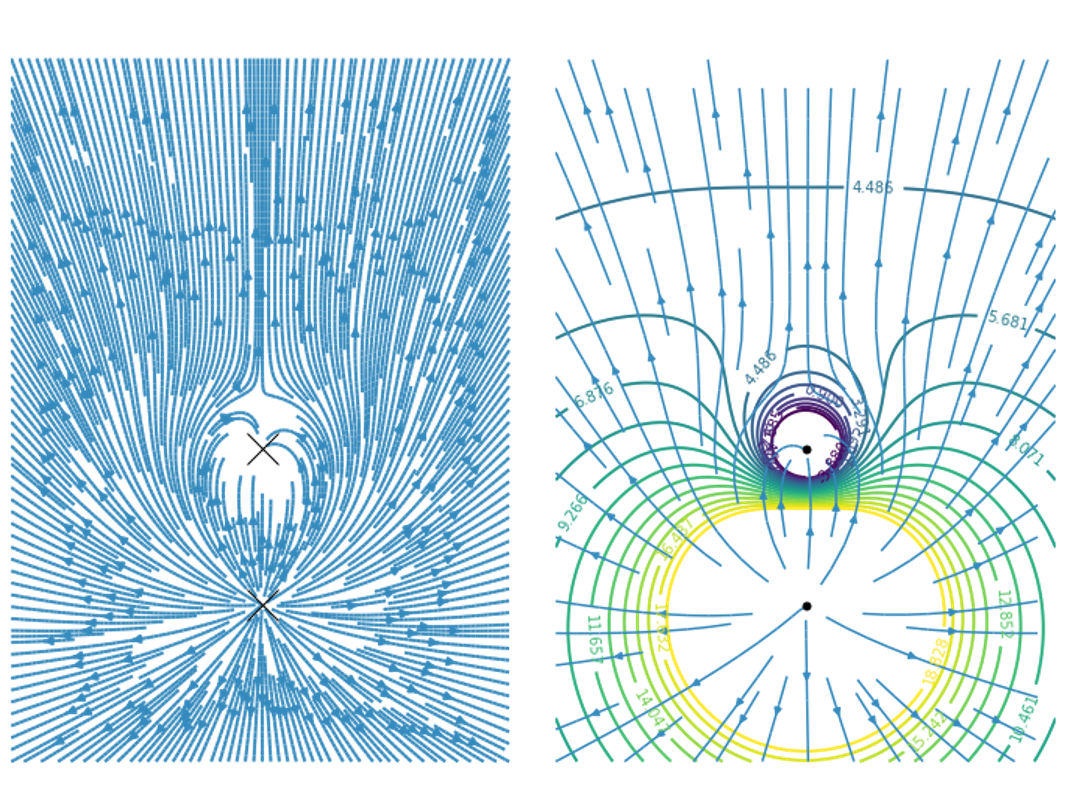
Inspired by a tweet, we follow a rabbit hole down the matplotlib path. We end up recreating a figure originally published by Maxwell regarding electrostatics.
Inspired by a tweet, we follow a rabbit hole down the matplotlib path. We end up recreating a figure originally published by Maxwell regarding electrostatics.
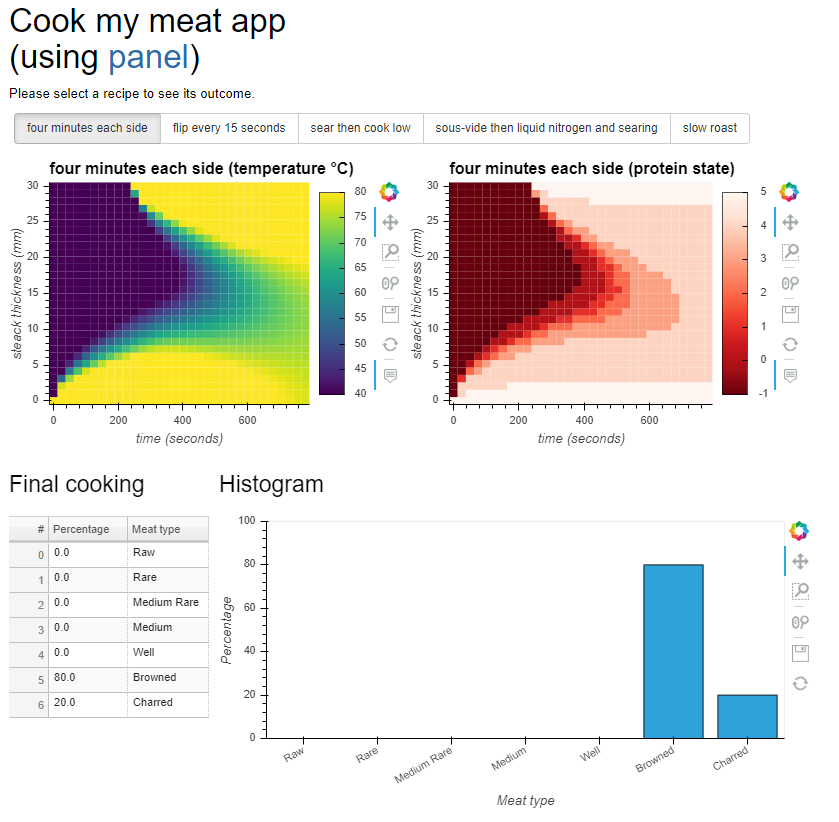
As a follow-up to our previous post, we present a simple interactive app built with recent Python dashboarding technology called Panel.
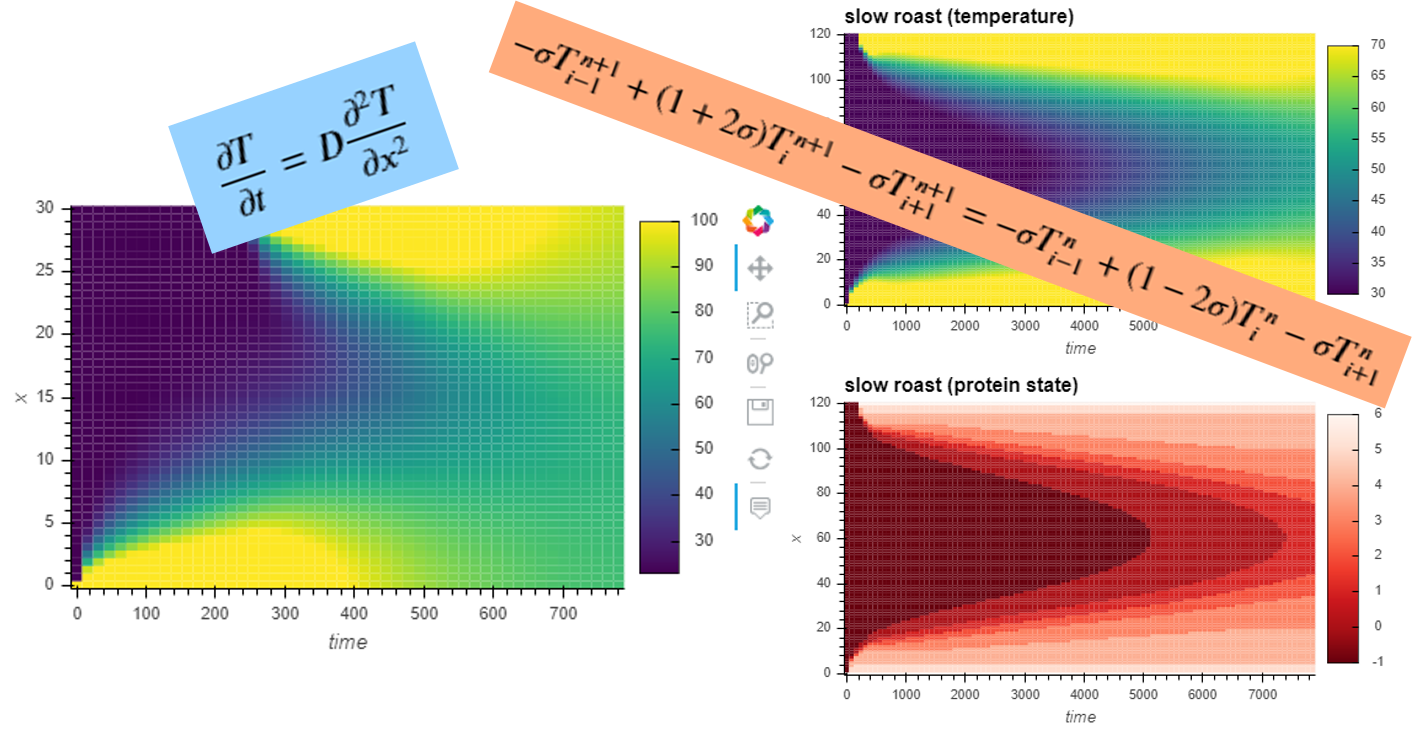
In the latest installment of posts about science in the kitchen, we solve the heat equation using the Crank-Nicolson scheme and apply it to the cooking of meat, following Harvard's Cook my Meat app.
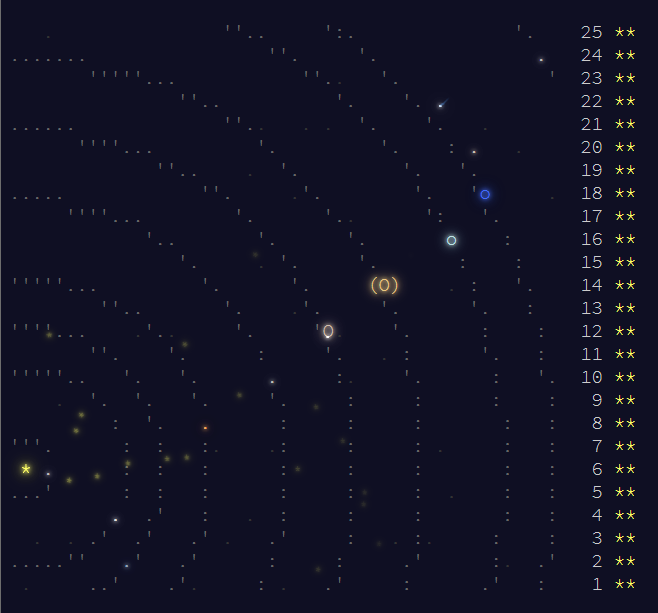
In this post, I reflect on the 2019 Advent of Code journey and how it felt to finish it.
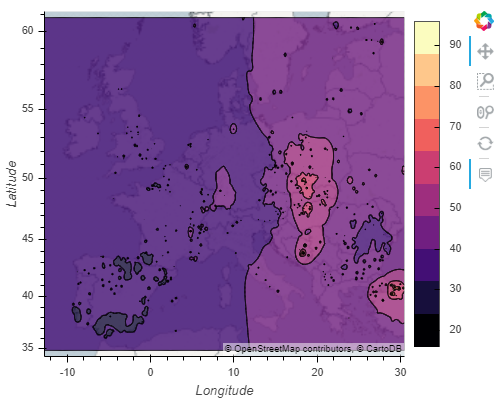
Using the World Air Quality Index API, we explore some of the possibilities and end up making a pollution map of Europe using GeoViews.
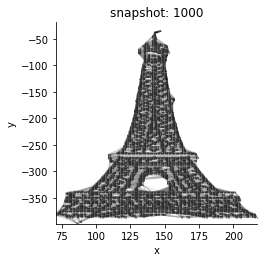
As a bonus for thinking about spring models, this blog post triangulates the Eiffel tower and then makes it wiggle.
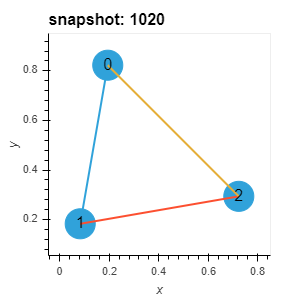
In this follow-up post to yesterday's spring dynamics, I try to replicate a numerical experiment mentioned in the DiffTaichi paper. The experiment is to adjust the physical parameters of a three spring system iteratively to reach a certain goal.

One of the simplest models you can use in physics is a spring. This notebook examines and animates a couple of simple spring physic models.

Since I'm developing a pitch-tracking application, I'm writing a little tutorial on how to use cepstral processing for f0 estimation.

We scrape the data from the Brewdog beer catalog to determine what an average beer looks like in terms of mash temperature, mash time and fermentation temperature.